Key Points
- Australian home prices fell another 1.6% in August and are now down by 3.5% from their high.
- Rising mortgage rates are the main driver and there is likely more to go. We continue to expect a 15-20% top to bottom fall in home prices out to the second half of next year, followed by a gradual recovery.
- There are three reasons why this downturn will likely be deeper and the recovery slower than in past cycles: higher home price to income levels; higher debt levels; and an end to the long-term decline in interest rates.
Introduction
“This time is different” have been described as the four most dangerous words in investing by Sir John Templeton. But there is good reason to believe this Australian home price downturn cycle will be different. Most assets (cash is an obvious exception) benefited from the downtrend in inflation and hence interest rates since the 1980s and are vulnerable to its reversal. While unlisted assets like property are slower to respond than listed assets, they are not immune. And residential property particularly so, as exposure to it is highly geared. Residential property price downturns in the last 25 years have mostly been mild, with prices falling less than 10% and brief, with prices quickly rebounding to new record highs as rates fell to new lows. This cycle may be different – both in terms of being deeper and taking longer to recover – thanks to a combination of high household debt levels, high home price to income levels and an end in the long-term downtrend in interest rates.
The slide in prices continues and is now broad based
Australian dwelling prices fell another 1.6% on average in August according to CoreLogic, their fourth monthly decline in a row, and their fastest monthly decline since the early 1980s recession. After surging 28.6% between their pandemic low in September 2020 to their high in April, average property prices have now fallen 3.5%, which is comparable to the pace of decline over four months going into the 1980s & 1990s recessions and the GFC. Prices fell 2.3% in Sydney for the sixth monthly decline in a row and they are now down 7.4% from their high. Seven of the eight capitals saw declines.
The drivers of the falls are: rising mortgage rates; poor affordability; a rotation in spending from goods back to services; cost of living pressures; higher listings; & poor confidence. The property boom is well and truly over as the surge in mortgage rates is pulling the rug out from under it.

Source: CoreLogic, AMP

Source: CoreLogic, AMP
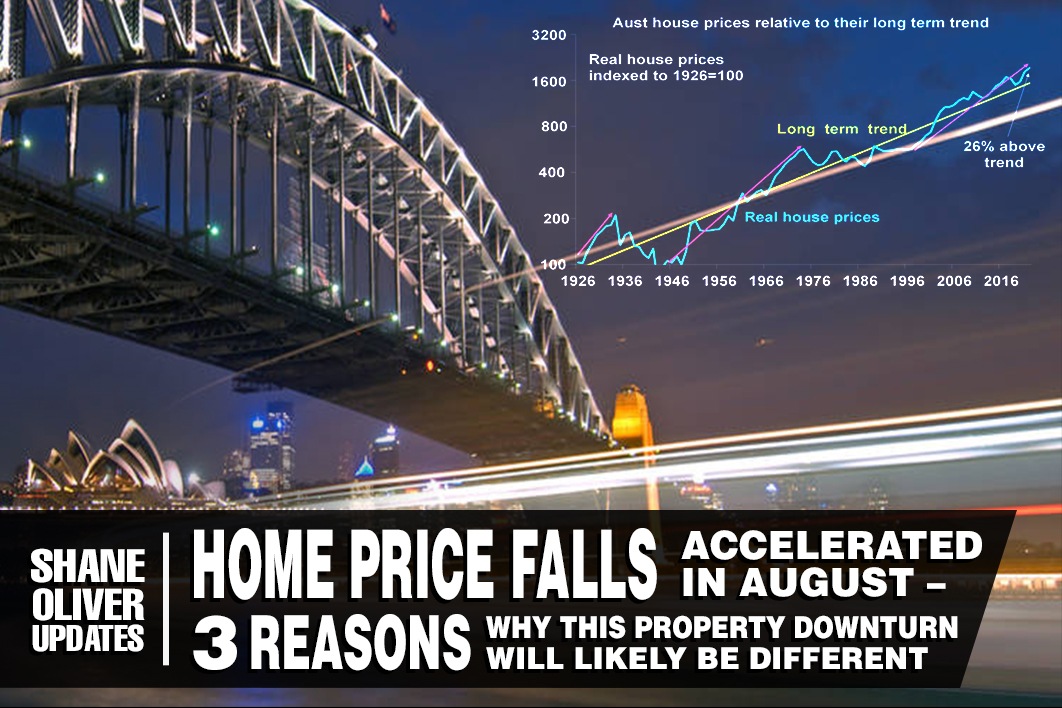
The long-term historical context
The past 100 years has seen a rising trend in real home prices. But there have been three major long-term booms – in the late 1920s, the post WW2 period and since the late 1990s. In between were weak periods in the 1930s-40s and 1970s.

Source: ABS, AMP
The boom over the last 25 years has seen real property prices rise from about 23% below their very long-term trend to 26% above. It has been largely driven by the shift to low interest rates and a surge in population relative to housing supply.
Lower rates led to more debt and higher prices
The next chart highlights the relationship between mortgage rates and the level of home prices. It can be seen that setbacks in home prices (highlighted with arrows) have generally been preceded by periods of rising rates (or tightening lending standards in the 2017-19 pullback). But it can also be seen that the big downswing in interest rates over the last 30 years has been associated with a long-term surge in Australian home prices as, while periods of monetary tightening drove price falls, this was quickly reversed as interest rates resumed their downtrend, seeing new record highs in home prices.

Source: RBA, CoreLogic, AMP
Put simply, the downtrend in interest rates between 1990 and 2021 enabled home buyers to borrow more & hence pay more for homes, pushing up prices. A poor dwelling supply response in the face of strong population growth since the mid-2000s enabled rapid price gains to persist. And it became self-feeding as rising home prices necessitated each new cohort of buyers to take on more debt to buy a home. The end result has been progressively higher home prices and debt relative to incomes.

Source: ABS, RBA, CoreLogic, AMP
Looked at from a purely investment perspective, lower inflation drove lower interest rates which in turn pushed up home prices relative to rents leading to a collapse in property rental yields - just as bond yields and yields on shares fell over the last few decades into their recent lows as inflation fell. The gross rental housing yield has fallen from over 8% in the early 1980s to a recent low of around 2.2%. The next chart breaks down the contribution to rolling gross 10-year housing property returns in Australia from rents (ie, the gross rental yield) and capital growth “due to” rental growth and changes in valuations (ie, the rise in prices relative to rents). Of course, this is a rough guide only as it assumes that rents from rental property are a good guide to the underlying services owner-occupied property provides. But it indicates that the decline in rental yields since the 1980s on the back of lower inflation and interest rates has boosted house prices by around 3% pa, or around 45% of the total increase in house prices. In other words, if inflation hadn’t fallen, driving interest rates down, which in turn drove home prices up and rental yields down annual home price growth since the 1980s may have been up to 3% pa lower.

Source: REIA, AMP
Three things that make this housing cycle different
So, the three things that make this property downturn different compared to past downturns in the last 25 years are that:
- First, home price to income ratios are now very high, which will limit their upside, unlike 30 years ago. Increased community concern about affordability may also limit upside.
- Similarly, household debt to income ratios are now very high - with less scope for a further increase, and in recent times there has been an increasing focus from bank regulators on limiting high debt to income ratio lending.
- Finally, the 32-year falling trend in mortgage rates from 17% in 1989 to 2% - which enabled new buyers to borrow & pay more for property and drove strong investor “search for yield” demand, is likely over. The world is now more inflation prone (with globalisation reversing, increased defence spending, decarbonisation & bigger government), so a return to a 0.1% cash rate & 2% fixed rates looks unlikely.
The long-term bull market in property prices from the 1990s was underpinned by a shift from low to high home prices to incomes, a similar shift in household debt relative to incomes and a long-term downtrend in interest rates. These are likely to have run their course. So we may now be seeing both a cyclical slump in property prices & a weakening in the long-term trend in property prices of the last 25 years or so. Together these point to a deeper fall in prices & a slower recovery through this cycle.
Expect average property prices to fall 15 to 20%
We expect national average property prices to fall further over the next 12 months as rising mortgage rates continue to impact. Increased listings in the spring selling season will likely add to pressure on prices and a surge in fixed rate loan expiries next year risks driving a sharp rise in distressed selling (as up to a quarter of home borrowers roll over into much higher mortgage rates) which will further add to downwards pressure on prices. Assuming the cash rate tops out around 2.6% early next year then average prices are likely to fall 15-20% top to bottom, of which we have so far seen 3.5%, with the low likely being reached in the second half of next year after interest rates peak and start to fall back. However, for the reasons noted above the recovery in prices is likely to be slower than seen in past cycles.
Risks
The main downside risk to our forecasts would be if the cash rate is raised to the 4% level the money market is assuming – this would more than double household interest payments and push total mortgage repayments to record highs relative to incomes & likely drive a 30% or so fall in prices. The resilience of spending to rate hikes so far (due to lags to when hikes impact) runs the risk that the RBA overtightens. There are two main upside risks. The first would be if inflation quickly subsides allowing the RBA to soon start easing. This looks unlikely. The second would be a rapid rebound in immigration exacerbating the shortage of housing evident in very tight rental markets.